Multiple Choice
Refer to the figure.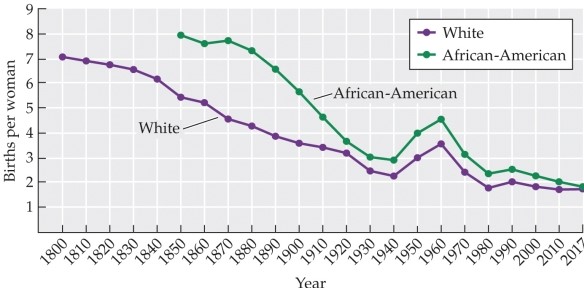 This graph shows births per woman by year for white and African-American women. Data for African-American women are shown with the green (top) line. What conclusion can be drawn from the information in the graph?
A) A decline in births correlates with a decline in sexual activity.
B) Declining births are due to the availability of the birth control pill.
C) Birth rates for both white and African-American women have declined since 1850.
D) Since 1850, births have declined for white women but not for African-American women.
E) Changes in the institution of marriage have caused a decline in the birth rate.
Correct Answer:

Verified
Correct Answer:
Verified
Q32: The community likely to have the highest
Q33: In some indigenous tribes of lowland South
Q34: The study of sexuality<br>A) includes all matters
Q35: Pawlowski and colleagues explored the question of
Q36: According to the textbook, which is a
Q38: Which problem occurred with the National Longitudinal
Q39: How have television and the internet shaped
Q40: Sociologists at the University of Chicago have
Q41: Which situation is an example of script
Q42: In a 2013 study, Perry and colleagues