Essay
Refer to the figures.
Figure 1
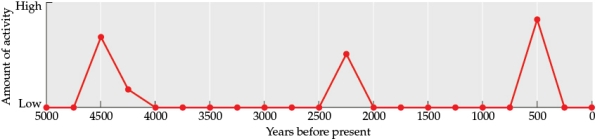 Figure 3
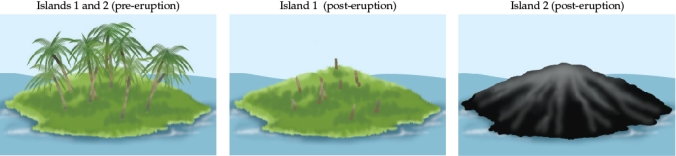 You are studying two islands (Figure 3) that have recently experienced volcanic activity. Both were formerly forested with palm trees. On island 1, a heat wave resulting from the volcanic eruption leads to the destruction of all the above-ground vegetation (middle figure). On island 2, a lava flow resulting from the volcanic eruption (right figure) completely covers the island.Answer the following questions:
a) How have the resources, environmental conditions, and species communities likely changed on the two islands as a result of the volcanic eruption?
b) Assume that the frequency of eruptions on the islands follows the pattern shown in Figure 1. Using data from Figures 1 and 3, create a graph (this will be referred to as Figure 4) using the frequency of eruptions to show where island 1 and island 2 would be located on the spectrum of disturbance. The x-axis should be frequency and the y-axis should be intensity.
c) Based on the frequency and intensity of the eruptions you plotted in Figure 4, what type of successional response would you predict for each island?
Correct Answer:

Verified
a) On island 1, the volcanic eruption de...View Answer
Unlock this answer now
Get Access to more Verified Answers free of charge
Correct Answer:
Verified
View Answer
Unlock this answer now
Get Access to more Verified Answers free of charge
Q16: Which statement about the amphibians that colonized
Q17: Which manipulation(s) did Bertness and Shumway perform
Q18: Which of the following would be considered
Q19: Connell and Sousa criticized Sutherland's experiments on
Q20: Suppose that following a lava flow, pine
Q22: The tolerance and the inhibition models of
Q23: Which statement about Bertness and Shumway's studies
Q24: The inability of a system to shift
Q25: Which statement best summarizes Elton's views on
Q26: Refer to the figures.<br>Figure 5<br> <img src="https://d2lvgg3v3hfg70.cloudfront.net/TBO1115/.jpg"