Essay
Refer to the tables.
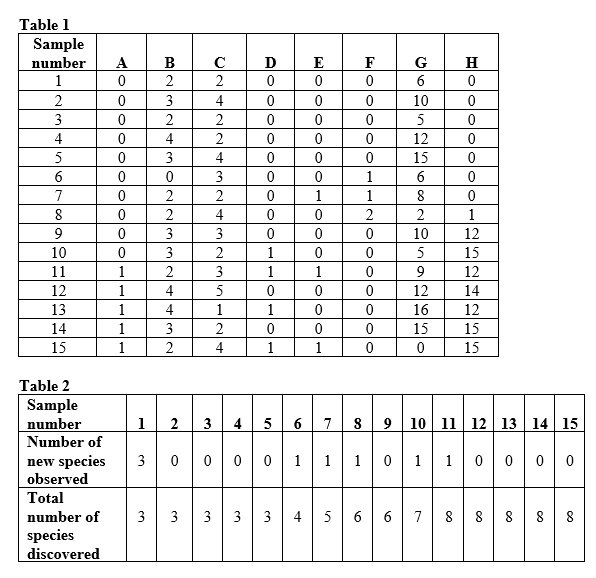 Suppose you are researching an ecological community in a new study area. You divide your study area into quadrats and sample one quadrat a day to determine the species that occupy the area and how many individuals of these species are present. Assume that by the end of your sampling efforts, you have identified all of the species that occur in the study area. Use the numbers of individuals from Table 1 and the number of species in Table 2 to graph the relationship between total individuals and total species identified during your sampling efforts (this will be referred to as Figure 1). Graph your data as a line graph.
Correct Answer:

Verified
Correct Answer:
Verified
Q17: Which scenario is a competitive network?<br>Scenario I:
Q18: Four species of fish in a pond
Q19: Estimates show that oceans absorb about _
Q20: Which statement about food webs is true?<br>A)
Q21: Which statement about keystone predators is true?<br>A)
Q23: Which statement about the difference between a
Q24: Which statement about the seagrass Posidonia oceanica
Q25: Lions prey on animals such as zebras
Q26: Refer to the table.<br><img src="https://d2lvgg3v3hfg70.cloudfront.net/TBO1115/.jpg" alt="Refer to
Q27: Estimates show that oceans absorb about _