Essay
Refer to the table and the figure.
Table 1
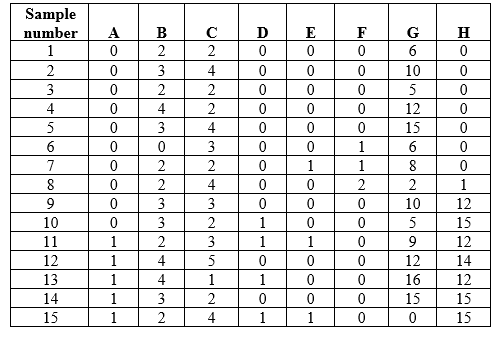 Figure 2
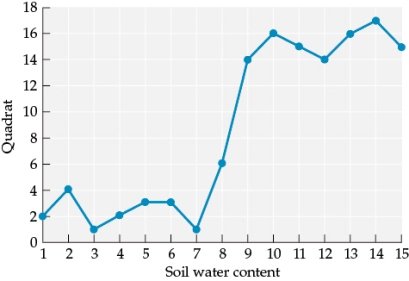 Suppose you are researching an ecological community in a new study area. You divide your study area into quadrats and sample one quadrat a day to determine the species that occupy the area and how many individuals of these species are present. Assume that by the end of your sampling efforts, you have identified all of the species that occur in the study area. Suppose that in addition to finding individuals and identifying species, you also collect information on abiotic factors and environmental conditions in the study area. Figure 2 shows how abiotic factors vary across the quadrats sampled. Based on your samples of the numbers of individuals of each species that occur in these quadrats (Table 1), which species is most affected by quadrat-level differences in soil water content? Based on both Table 1 and Figure 2, how would you define communities and determine the number of communities in your study area? How might this information influence how you categorize your quadrats into communities?
Correct Answer:

Verified
Species H is most affected by soil water...View Answer
Unlock this answer now
Get Access to more Verified Answers free of charge
Correct Answer:
Verified
View Answer
Unlock this answer now
Get Access to more Verified Answers free of charge
Q61: Suppose you are wanting to study a
Q62: The studies by Power and colleagues of
Q63: Refer to the table.<br>Table 3: Species Abundance
Q64: Ecologists are concerned about the establishment of
Q65: Refer to the figure.<br><img src="https://d2lvgg3v3hfg70.cloudfront.net/TBO1115/.jpg" alt="Refer to
Q66: Cougars prey on both white-tailed deer and
Q67: The lowest possible value of the Shannon
Q68: Which statement about the "killer alga," Caulerpa
Q69: Refer to the table.<br>Table 10<br> <img src="https://d2lvgg3v3hfg70.cloudfront.net/TBO1115/.jpg"
Q71: Which technique was used to determine the