Multiple Choice
Refer to the figure.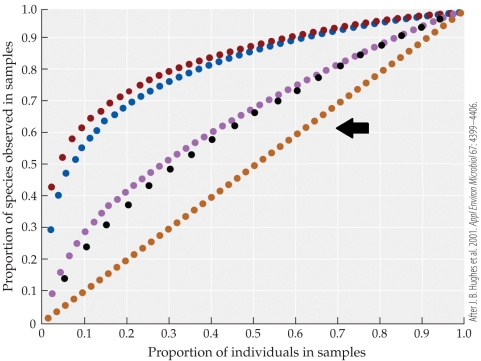 The figure is of a species accumulation curve, based on the studies of Hughes and colleagues. The orange line (indicated by the black arrow) represents the species accumulation curve for which community in the study?
A) Plants in a temperate forest in Michigan
B) Human oral bacteria
C) Costa Rica moth species
D) East Amazonian soil bacteria
Correct Answer:

Verified
Correct Answer:
Verified
Q25: Lions prey on animals such as zebras
Q26: Refer to the table.<br><img src="https://d2lvgg3v3hfg70.cloudfront.net/TBO1115/.jpg" alt="Refer to
Q27: Estimates show that oceans absorb about _
Q28: Suppose two populations of Anolis lizards are
Q29: In their studies of a salt marsh
Q31: The trophic facilitation phenomenon described by Hacker
Q32: What is the Shannon index value for
Q33: Consider two tropical forests, each of which
Q34: What is the primary difference between interaction
Q35: If a biologist wanted to study a