Multiple Choice
Refer to the figure.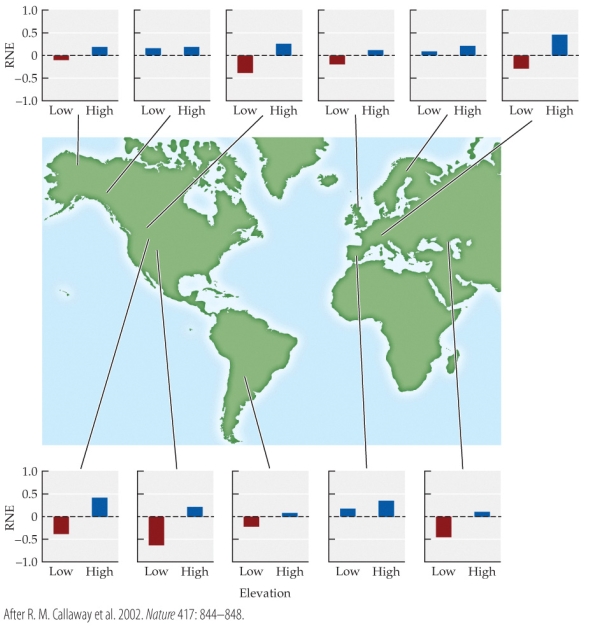 The RNE (relative neighbor effect) measures growth of a target plant species in the presence and absence of neighboring species. The figure shows graphs of the RNE at eleven sites around the world. RNE was measured at high and at low elevations at each site. RNE values above zero (blue) indicate that neighboring plants increased the growth of target species; RNE values below zero (red) indicate that neighbors decreased target species growth.
-This study showed that the presence of neighboring plants most often benefited the target plants at
A) high-elevation sites.
B) low-elevation sites.
C) sites in North America only.
D) sites in Europe only.
Correct Answer:

Verified
Correct Answer:
Verified
Q6: An ant colony maintains and farms a
Q7: Refer to the table.<br><img src="https://d2lvgg3v3hfg70.cloudfront.net/TBO1115/.jpg" alt="Refer to
Q8: A seedling begins to grow very close
Q9: For an ecological interaction to be a
Q10: Refer to the figure. <br><img src="https://d2lvgg3v3hfg70.cloudfront.net/TBO1115/.jpg" alt="Refer
Q12: In a prairie ecosystem, mycorrhizal fungi form
Q13: What characteristics are found in Pseudomyrmex ants
Q14: Yucca plants retain 62% of the flowers
Q15: Humans have associated with canines throughout history,
Q16: The loss of mycorrhizae-plant associations, in both