Multiple Choice
Refer to the figure.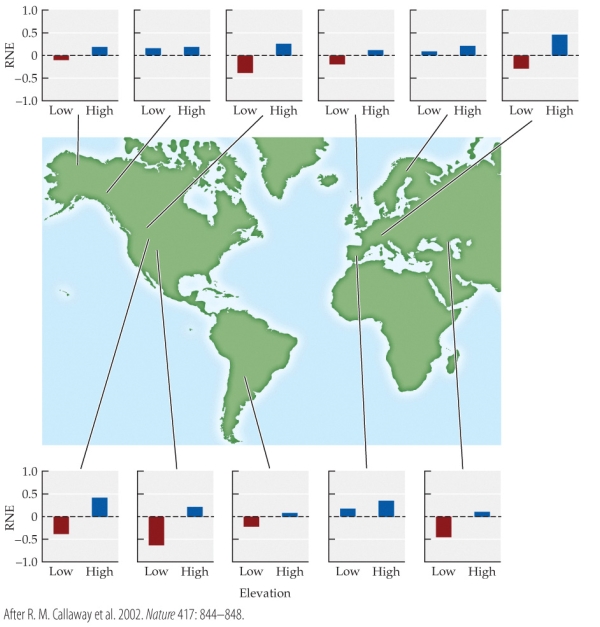 The RNE (relative neighbor effect) measures growth of a target plant species in the presence and absence of neighboring species. The figure shows graphs of the RNE at eleven sites around the world. RNE was measured at high and at low elevations at each site. RNE values above zero (blue) indicate that neighboring plants increased the growth of target species; RNE values below zero (red) indicate that neighbors decreased target species growth.
-What type of ecological interaction did plants show at high elevations and at low elevations, respectively?
A) High: mutualists; low: mutualists
B) High: mutualists; low: parasites
C) High: mutualists; low: competitors
D) High: competitors; low: mutualists
Correct Answer:

Verified
Correct Answer:
Verified
Q51: Refer to the table.<br><img src="https://d2lvgg3v3hfg70.cloudfront.net/TBO1115/.jpg" alt="Refer to
Q52: Leaf-cutter ants are part of a complex
Q53: Refer to the figure.<br><img src="https://d2lvgg3v3hfg70.cloudfront.net/TBO1115/.jpg" alt="Refer to
Q54: Three examples of associations in nature include:
Q55: Because leaf-cutter ants and fungi help each
Q57: When leaf-cutter ants encounter the parasitic fungus
Q58: Which criterion is most important in determining
Q59: The interaction of fig trees and fig
Q60: Which factor in the association between figs
Q61: Most wasps are carnivores, but one group