Multiple Choice
Refer to the figure.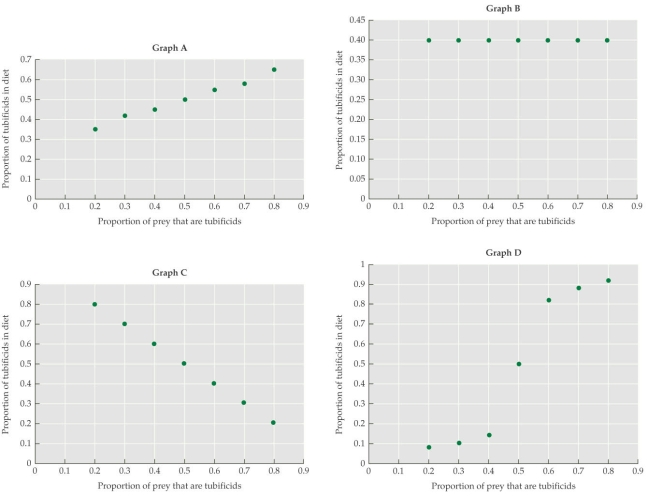 The graphs show different relationships between the proportion of prey that are tubificids and the proportion that are eaten by predators (guppies) . Based on research by Murdoch et al., which graph best represents the foraging habits of guppies?
A) Graph A
B) Graph B
C) Graph C
D) Graph D
Correct Answer:

Verified
Correct Answer:
Verified
Q21: In the studies of clipping in gentians,
Q22: Use the following simple predator-prey relationships to
Q23: The Lotka‒Volterra predator‒prey model of population growth<br>A)
Q24: When animals are exposed to chronic stress,
Q25: The introduction of arctic foxes to some
Q27: Huge numbers of adult periodic cicadas emerge
Q28: Department of Natural Resource managers, biologists, and
Q29: Züst and colleagues found that<br>A) plants with
Q30: Which observation led ecologists to conclude that
Q31: Suppose that a predatory fish eats only