Essay
Refer to the figures.
Figure 1
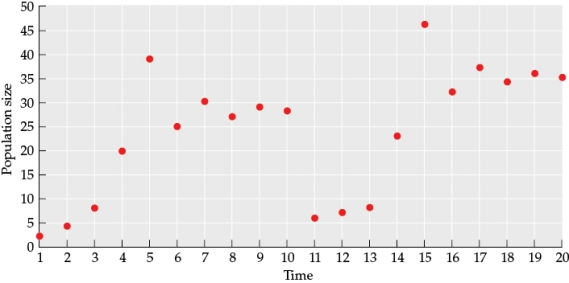 Figure 2
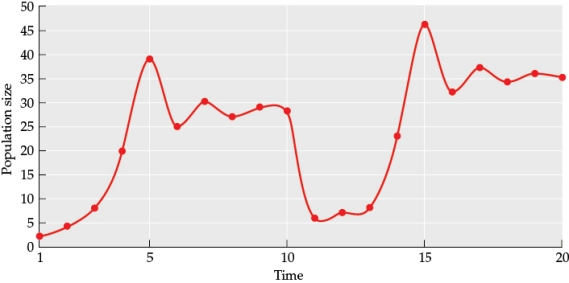 Figure 3
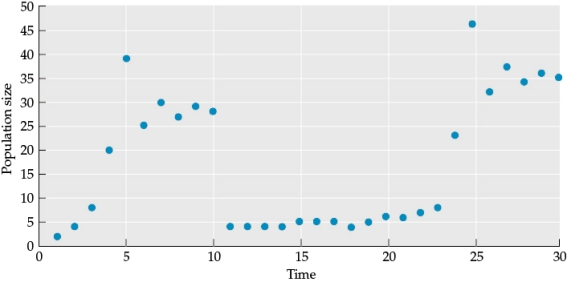 Suppose the population shows the pattern in Figure 3. Draw a new figure (this will be referred to as Figure 4) with a line that indicates how population size changed over time. What is the major difference between this pattern and the pattern in Figure 2? What are two factors that might be causing the pattern in Figure 4?
Correct Answer:

Verified
Figure 4
 The major difference is that ...
View Answer
Unlock this answer now
Get Access to more Verified Answers free of charge
Correct Answer:
Verified
View Answer
Unlock this answer now
Get Access to more Verified Answers free of charge
Q1: Refer to the figures.<br>Figure 1<br> <img src="https://d2lvgg3v3hfg70.cloudfront.net/TBO1115/.jpg"
Q2: A population of lions in the Ngorongoro
Q3: In a population of three asexual lizards,
Q4: Population cycles in all small rodents are
Q6: Suppose that only two females and a
Q7: Which of the following best describes an
Q8: Suppose you are studying two small lakes
Q9: During a hurricane, a large segment of
Q10: Which pattern of population dynamics best describes
Q11: Allstadt et al. (2013) found that population