Multiple Choice
Refer to the figure.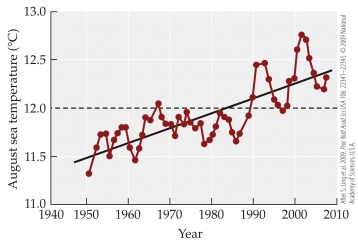 From 1950 to 2010, the average sea temperature has _______ approximately _______oC.
A) decreased; 10
B) increased; 10
C) decreased; 1
D) increased; 1
Correct Answer:

Verified
Correct Answer:
Verified
Related Questions
Q56: A species limited capacity to disperse, preventing
Q57: Which statement does not represent an assumption
Q58: A researcher studying apple maggot flies marks
Q59: Some animals (e.g., whiptail lizards) and plants
Q60: Which statement about populations is false?<br>A) If
Q62: Only a small proportion of the world's
Q63: Place a species distribution in order from
Q64: Suppose that two species of rabbits inhabit
Q65: Individuals of a plant species are counted
Q66: An evolutionary ecologist is studying the evolutionary