Multiple Choice
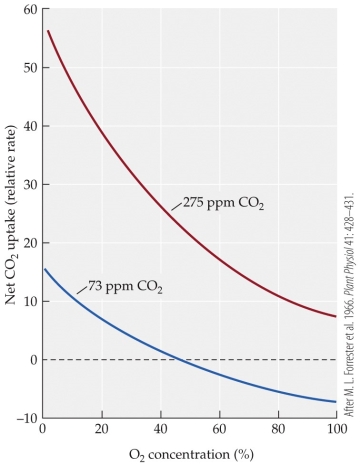
Refer to the figure showing the CO2 uptake in soybean leaves in response to increasing O2 concentration for soybean leaves exposed to two different CO2 levels. Based on the figure, the best explanation for the relationship of CO2 uptake and O2 concentration is that
A) CO2 uptake increases with increasing O2 concentration at both CO2 levels.
B) CO2 uptake decreases with increasing O2 concentration at both CO2 levels.
C) CO2 uptake becomes negative by 100% O2 concentration at both CO2 levels.
D) CO2 uptake becomes negative by 100% O2 concentration at high CO2 levels.
Correct Answer:

Verified
Correct Answer:
Verified
Q8: When you touch something hot, your hand
Q9: If photosynthesis had not developed on Earth,
Q10: Refer to the table showing the oxygen
Q11: Which two pathways, which provide high concentrations
Q12: As CO<sub>2</sub> concentrations continue to increase in
Q14: To determine where plants obtain the raw
Q15: Refer to the figure showing the results
Q16: There are three basic photosynthetic pathways: C<sub>3</sub>,
Q17: Suppose that the bottlenose dolphin population in
Q18: Which of these organisms would be considered