Multiple Choice
Refer to the figure showing the results of Bjorkman and colleagues' studies of plant responses to different light levels. The plants were reared at three different levels of light: high (red line) , medium (blue line) , and low (green line) . The acclimatized plants were then subjected to various light levels, and their ability to photosynthesize was measured.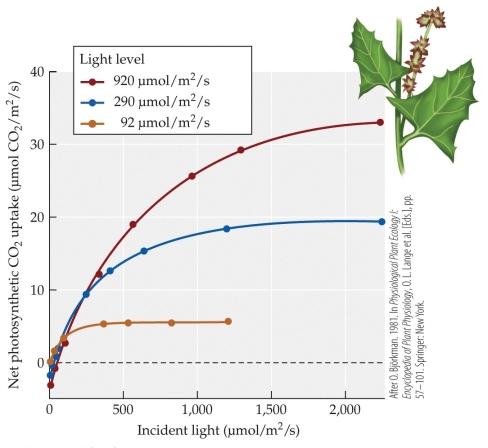 At the light intensity of 1,500 μmol/m2/s, which plants are light-limited?
A) Those acclimatized to high-intensity light
B) Those acclimatized to medium-intensity light
C) Those acclimatized to low-intensity light
D) None; they have all reached the light saturation point.
Correct Answer:

Verified
Correct Answer:
Verified
Q54: Suppose that a small plant, through photosynthesis,
Q55: When heterotrophs consume food (organic compounds), they
Q56: Refer to the figure showing the pattern
Q57: Both New Caledonian crows and bottlenose dolphins
Q58: The bacteria and archaea that inhabited the
Q60: In contrast to C<sub>3</sub> plants, C<sub>4</sub> plants
Q61: Suppose a crow normally uses 50 energy
Q62: Which of these organisms are not heterotrophs?<br>A)
Q63: Suppose that a small plant, through photosynthesis,
Q64: The ratio of carbon-13 to carbon-12 in