Essay
Refer to the figure.
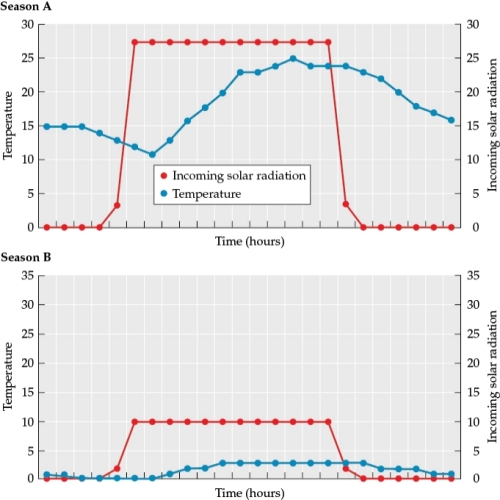
- You are one of a team of scientists studying a newly-discovered planet. You are receiving data from a probe that was landed on the planet by an unmanned mission. Your team is working with the little data you have from the probe to learn as much as you can about the planet's basic characteristics. The figure illustrates data collected by the probe at the same location on the planet during what you suspect are two different seasons (season A and season B). The average daily temperature of the probe during season A is about 19°C while the average temperature of the same location in season B is 2°C. Imagine instead that the averages recorded were 40°C in season A and -20°C in season B. List three characteristics of the planet that, if they were different, could cause these more extreme seasonal differences. Justify your answers.
Correct Answer:

Verified
If the planet had a more pronounced elli...View Answer
Unlock this answer now
Get Access to more Verified Answers free of charge
Correct Answer:
Verified
View Answer
Unlock this answer now
Get Access to more Verified Answers free of charge
Q6: Which statement about ice is true?<br>A) It
Q7: Refer to the map.<br><img src="https://d2lvgg3v3hfg70.cloudfront.net/TBO1115/.jpg" alt="Refer to
Q8: The Coriolis effect causes moving air at
Q9: High productivity in the open ocean would
Q10: In equatorial regions, the sun's rays
Q12: What is measured by the lapse rate?<br>A)
Q13: Refer to the figure.<br><img src="https://d2lvgg3v3hfg70.cloudfront.net/TBO1115/.jpg" alt="Refer to
Q14: Refer to the figure.<br> <img src="https://d2lvgg3v3hfg70.cloudfront.net/TBO1115/.jpg" alt="Refer
Q15: The Connecticut River valley in western New
Q16: Compared with land at the same latitude,