Multiple Choice
Refer to the figure.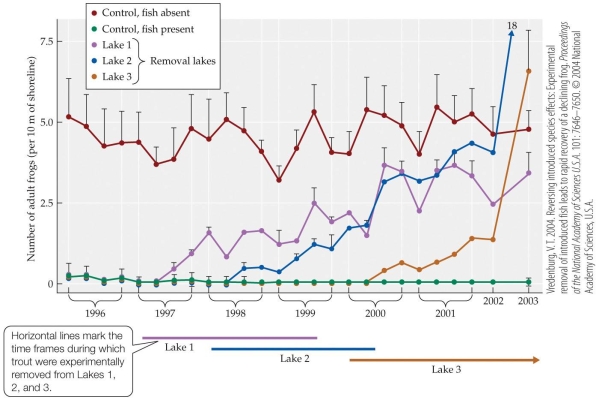 The figure represents the results of an experiment by Vredenburg, who compared the numbers of frogs in several categories of lakes: lakes never having trout (control) , lakes having trout (control) , and lakes from which he removed trout at different times. He observed changes in frog populations over eight years in all lakes. Based on evidence from the figure, which conclusion can be made about the effect of trout removal on frog populations?
A) Frog populations in some lakes overpopulate after the removal of trout.
B) Frog populations increase in some removal lakes but not in others.
C) Frog populations never recover once trout have been introduced.
D) Frog populations begin to recover once trout are removed.
Correct Answer:

Verified
Correct Answer:
Verified
Q17: Would you use an observational, experimental, or
Q18: A team of researchers investigated the effects
Q19: It is difficult to study the process
Q20: Which of the following is an abiotic
Q21: West Nile virus can be considered an
Q23: In addition to the frogs themselves, which
Q24: Refer to the figure.<br><img src="https://d2lvgg3v3hfg70.cloudfront.net/TBO1115/.jpg" alt="Refer to
Q25: Suppose that individuals of a particular strain
Q26: Scientist A works in a laboratory, studying
Q27: An example of a trait that cannot