Multiple Choice
Figure 5.3
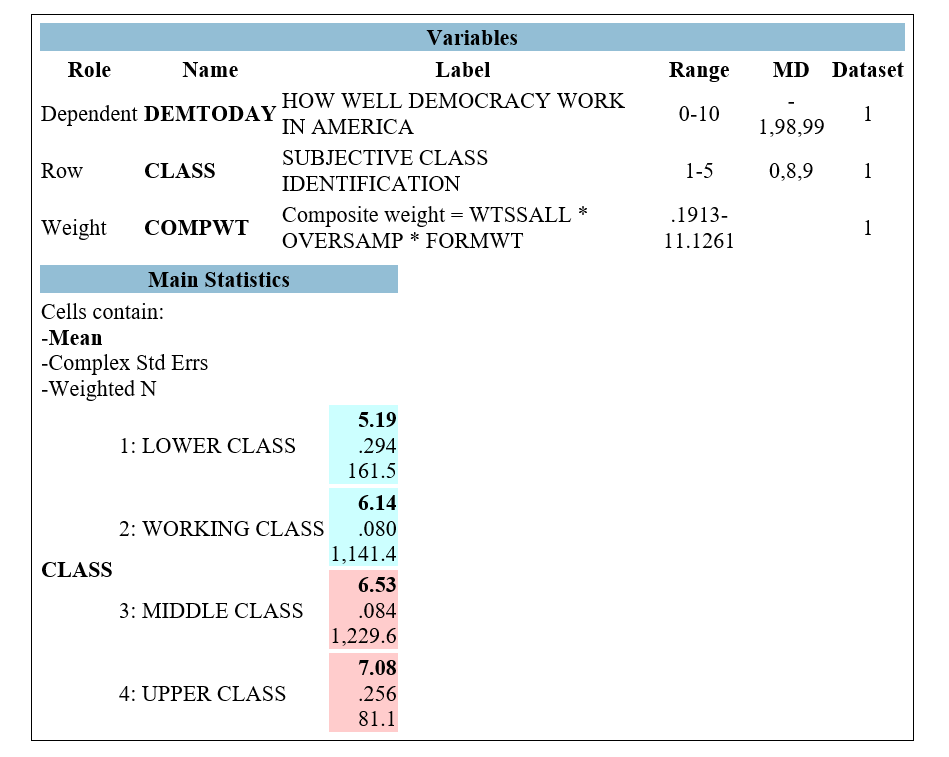
-What is the best interpretation of the top number in the resulting table of "Main Statistics" (5.19) ?
A) 5.19% of respondents identified as lower class.
B) Among respondents who identified as lower class, 5.19% believed that democracy is not working well in American today.
C) Among respondents who identified as lower class, the mean score on the variable DEMTODAY was 5.19
D) The likelihood of believing that democracy is not working well in American today is 5.19 times higher lower-class respondents, compared to upper-class respondents.
Correct Answer:

Verified
Correct Answer:
Verified
Q1: A researcher is interested to know whether
Q2: A researcher is interested to know whether
Q3: A researcher is interested to know whether
Q4: A researcher is interested to know whether
Q5: Figure 5.3<br> <img src="https://d2lvgg3v3hfg70.cloudfront.net/TBG1012/.jpg" alt="Figure 5.3
Q6: A researcher is interested to know whether
Q7: A researcher is interested to know whether
Q9: A researcher is interested to know whether
Q10: A researcher is interested to know whether