Multiple Choice
Refer to the figure below showing projections of population trends for woodpeckers. Scenario 1 is no change (current conditions) , Scenario 2 is enhanced adult survival, and Scenario 3 is enhanced juvenile survival.
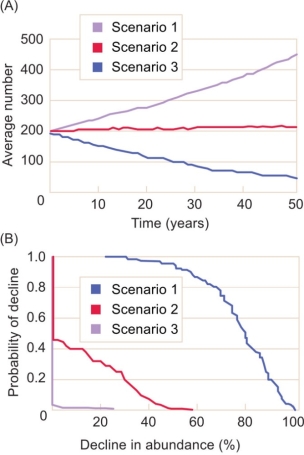
-Based on this figure, which of the following conclusions is true?
A) Enhancing juvenile populations will lead to increased probability of low percent decline in abundance.
B) Maintaining the current trends will cause both juveniles and adults to increase in number.
C) The highest probability of decline is associated with enhancing adult survival.
D) The best approach for maintaining populations at their current, stable level is to make no changes.
E) Enhancing the survival of either juveniles or adults would come at great cost.
Correct Answer:

Verified
Correct Answer:
Verified
Q2: The role of scientists in policy making
Q3: What is the role of scientists in
Q4: Explain how sensitivity analysis is used as
Q5: A mathematical description of a population is
Q6: Which of the following is not part
Q8: Policy from international agencies<br>A) includes managing local
Q9: Risk assessment is most effective if the
Q10: Which of the following statements about uncertainty
Q11: Methods of evaluating or reducing uncertainty do
Q12: Population viability analysis is not used for<br>A)