Essay
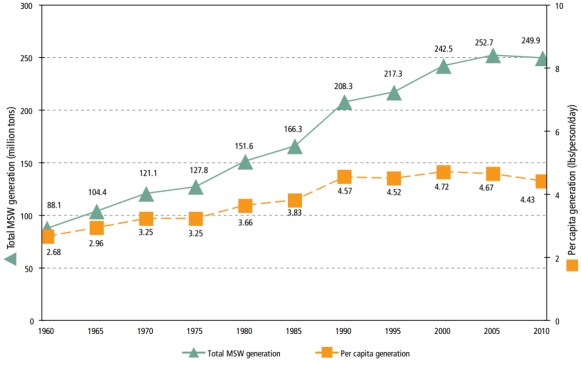
Refer to the figure below showing the US MSW generation rates from 1960 to 2010. Explain the trend in per capita waste generation from 1960-1990 compared to 1990-2010.
 (Source: http://www.epa.gov/osw/nonhaz/municipal/msw99.htm)
Correct Answer:

Verified
From 1960-1990, per capita waste generat...View Answer
Unlock this answer now
Get Access to more Verified Answers free of charge
Correct Answer:
Verified
View Answer
Unlock this answer now
Get Access to more Verified Answers free of charge
Q11: Radioisotope Q has a half-life of 1
Q12: If Yucca Mountain were to open tomorrow
Q13: The measure of the extent to which
Q14: Refer to the table below showing the
Q15: What is material substitution? Give a simple
Q17: Compare and contrast waste mining and dematerialization.
Q18: More than 90% of the radioisotopes on
Q19: The waste product that currently has the
Q20: The country with the highest nuclear fuel
Q21: Land disposal has been the typical means