Essay
Refer to the graph below showing the change in the number of individuals over time for a population limited by density dependence.
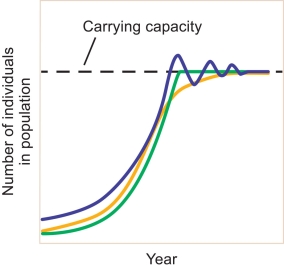
-In which portion of the graph will harvesting have the least impact on the harvested population? Why?
Correct Answer:

Verified
Highest growth rates are experienced at ...View Answer
Unlock this answer now
Get Access to more Verified Answers free of charge
Correct Answer:
Verified
View Answer
Unlock this answer now
Get Access to more Verified Answers free of charge
Q3: Land use planning is the study of
Q4: Which of the following is not an
Q5: The United Nations and the Ecological Society
Q6: In comparing biotic resources to abiotic resources,
Q7: Explain how overpopulation can lead to an
Q9: Which of the following is not an
Q10: _ is/are a factor in density dependent
Q11: The greatest problem in sustainable natural resource
Q12: Give a real life example of the
Q13: What are agricultural reserves?<br>A) Deep, rich soils