Multiple Choice
The graph below shows an expectations-augmented Phillips curve. If inflation is higher than expected, then unemployment is below the natural rate. If inflation is lower than expected, then unemployment is higher than the natural rate. For example, if inflation is expected to be 5% but actual inflation is 2%, then: 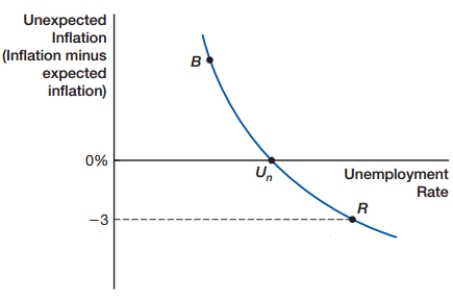
A) inflation will be at 3%.
B) the economy will be at the point Un.
C) the economy will be at the point
D) the economy will be at the point R.
Correct Answer:

Verified
Correct Answer:
Verified
Q42: If nominal GDP is higher than expected,
Q43: Manu has received a 2% raise each
Q44: Evidence over time indicates that the relationship
Q45: Jonah earned a C in ECON 101,
Q46: In the short run, there _ a
Q48: Jane assumes that tomorrow's weather will be
Q49: The simple Phillips curve relies on the
Q50: Nominal GDP targeting is a policy approach
Q51: Which of the following situations would NOT
Q52: A credible policy is defined as a