Multiple Choice
(Figure: Expectations 0) In the figure, what is the inflation rate at point c?
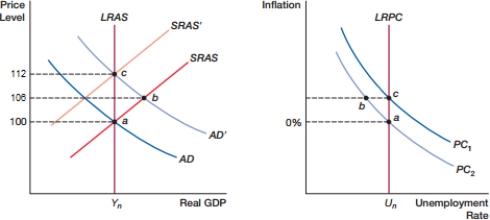
A) 0%
B) 3%
C) 6%
D) 12%
Correct Answer:

Verified
Correct Answer:
Verified
Related Questions
Q49: The simple Phillips curve relies on the
Q50: Nominal GDP targeting is a policy approach
Q51: Which of the following situations would NOT
Q52: A credible policy is defined as a
Q53: What movement would occur on an economy's
Q55: When will the economy be at a
Q56: Summarize three flaws in the simple Phillips
Q57: The simple Phillips curve model continues to
Q58: What happens on the expectations-augmented Phillips curve
Q59: The theory that when inflation expectations adjust