Multiple Choice
(Figure: Expectations A) In the figure, what is the inflation rate at point c?
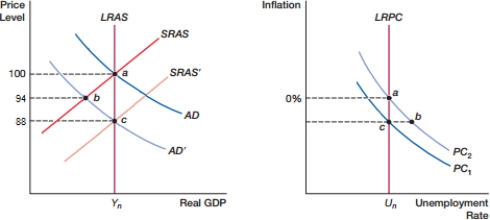
A) -12%
B) -6%
C) 6%
D) 12%
Correct Answer:

Verified
Correct Answer:
Verified
Related Questions
Q86: As a former chair of the Federal
Q87: The view that past correlations may not
Q88: Which of the following is NOT likely
Q89: The natural rate theory is based on
Q90: (Figure: Demand Shock Alpha) The movement shown
Q92: Wages are most likely to rise during
Q93: According to the expectations-augmented Phillips curve, when
Q94: The simple Phillips curve model was _
Q95: Unemployment is higher than the natural rate
Q96: Which of the following is NOT consistent