Multiple Choice
(Figure: Changing Demand) What do graphs "A" and "B" represent for an economy?
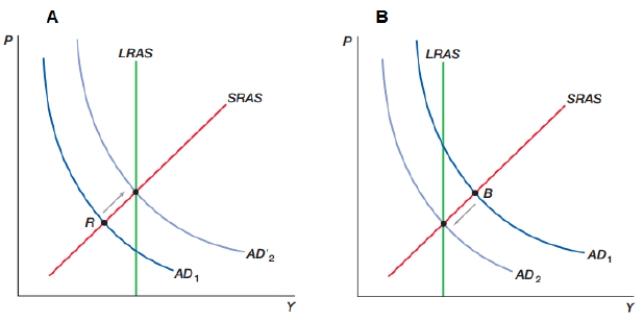
A) "A" represents an expansionary monetary policy; "B" represents a contractionary monetary policy
B) "A" represents a contractionary monetary policy; "B" represents an expansionary monetary policy
C) "A" represents an economy moving out of an inflationary boom; "B" represents an economy moving out of a recession
D) "A" represents a decrease in money supply; "B" represents an increase in money supply
Correct Answer:

Verified
Correct Answer:
Verified
Q98: (Figure: Decrease in Money Supply) The figure
Q99: The goal of monetary policymakers with regard
Q100: New Keynesians do NOT believe that:<br>A) monetary
Q101: When economic forces push the economy toward
Q102: Low interest rates could exist due to
Q103: If the Federal Reserve wants to cause
Q104: The Keynesian approach to policy focuses on
Q105: Rising stock prices lead investors to buy
Q106: An economy is in a liquidity trap
Q108: Use the Fisher effect to explain how