Multiple Choice
(Figure: ASAD0) In the figure, in the 1930s the economy moved from point 1 to 2. What does point 2 suggest?
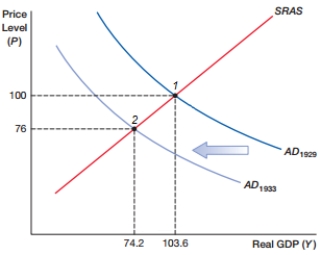
A) economic growth
B) inflation
C) a recession
D) disinflation
Correct Answer:

Verified
Correct Answer:
Verified
Related Questions
Q102: Which of the following is something that
Q103: Which of the following would NOT shift
Q104: The aggregate demand curve has a slope
Q105: On the aggregate demand/aggregate supply graph, an
Q106: What causes stagflation?<br>A) Aggregate demand increases.<br>B) Aggregate
Q108: When an economy self-corrects from inflation the
Q109: If a country's short-run aggregate supply increases,
Q110: Which of the following is NOT a
Q111: Which of the following would NOT cause
Q112: What happens in an economy when short-run