Multiple Choice
(Figure: ASAD0) In the figure, the price level went from 100 to 76. This suggests the economy was experiencing a(n) :
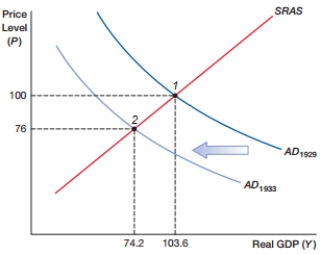
A) inflationary recession
B) inflationary expansion
C) deflationary recession
D) deflationary expansion
Correct Answer:

Verified
Correct Answer:
Verified
Related Questions
Q79: (Figure: SRASA) In the figure, what will
Q80: The Martinez household has $40,000 in savings
Q81: If Econia's aggregate demand falls, the price
Q82: In the short run, when the average
Q83: When the average price level of a
Q85: Stagflation is present when the inflation rate
Q86: Which of the following is NOT true
Q87: (Figure: LRAS0) In the figure, the economy
Q88: How will a recession end if an
Q89: A nation's natural rate of output is