Multiple Choice
(Figure: Natural Rate) What does the figure represent?
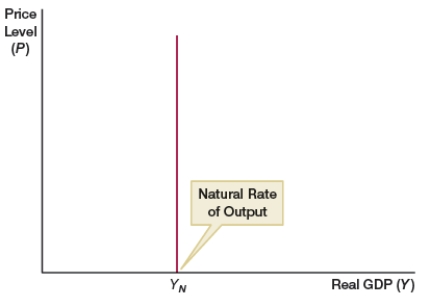
A) long-run aggregate demand curve
B) short-run aggregate demand curve
C) long-run aggregate supply curve
D) short-run aggregate supply curve
Correct Answer:

Verified
Correct Answer:
Verified
Related Questions
Q50: (Figure: SRAS0) In the figure, what will
Q51: Which of the following would cause a
Q52: What type of shock did the U.S.
Q53: An increase in spending has what impact
Q54: In the context of aggregate demand, the
Q56: (Figure: SRASA) In the figure, what will
Q57: In the short run, a contractionary supply
Q58: In the short run, what type of
Q59: The slope of the long-run aggregate supply
Q60: When aggregate demand declines, an economy will