Multiple Choice
(Figure: Curve 0) What does the figure represent?
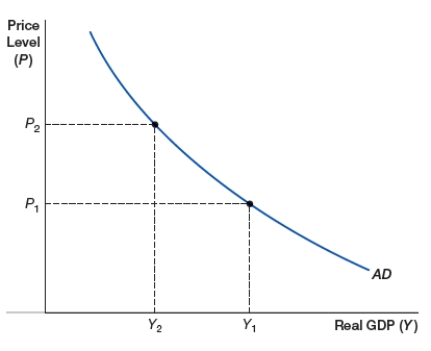
A) aggregate demand curve
B) demand curve
C) aggregate supply curve
D) supply curve
Correct Answer:

Verified
Correct Answer:
Verified
Related Questions
Q38: A shift in an aggregate demand curve
Q39: Which of the following would cause inflation?<br>A)
Q40: (Figure: Decline in Aggregate Supply) The figure
Q41: Briefly describe the three reasons that the
Q42: According to the net exports effect, along
Q44: (Figure: SRAS0) In the figure, what will
Q45: What happens in an economy when aggregate
Q46: Which of the following would cause inflation?<br>A)
Q47: What is stagflation? Use the aggregate supply
Q48: How is economic growth shown on a