Multiple Choice
(Figure: Decrease in Aggregate Demand) The figure shows a shift of aggregate demand curve to the left due to one or more of the following sources, EXCEPT:
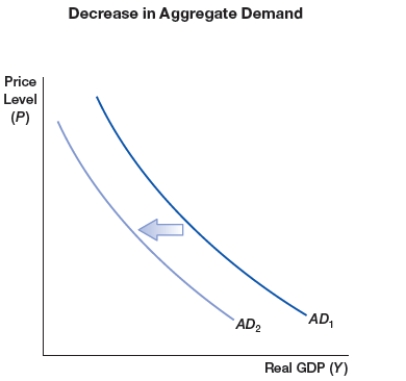
A) increase in taxes
B) decrease in money supply
C) decrease in government spending
D) optimistic expectations
Correct Answer:

Verified
Correct Answer:
Verified
Q27: How will an inflationary boom end if
Q28: After a contractionary demand shock, the average
Q29: (Figure: SRAS0) In the figure, what will
Q30: Cost-push inflation is caused by:<br>A) an increase
Q31: Econia's unemployment rate is 7.5%, and its
Q33: A study of the frequency of price
Q34: What determines national output on the long-run
Q35: In the short run, an expansionary supply
Q36: After an increase in consumer confidence leads
Q37: Which of the following is NOT a