Multiple Choice
(Figure: Lorenz Curve 0) In the figure, the Gini coefficient is calculated by:
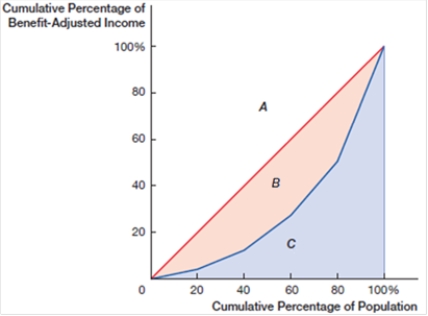
A) Area A / Area B.
B) Area A / Area A + Area B.
C) Area B / Area C.
D) Area B / Area B + Area C.
Correct Answer:

Verified
Correct Answer:
Verified
Related Questions
Q15: The _ is a summary measurement of
Q16: A _ is a statistical unit that
Q17: When implicit marginal tax rates are excessively
Q18: (Figure: Lorenz Curve) In the figure, the
Q19: The earned income tax credit is designed
Q21: High-income households are increasingly likely to be
Q22: Bart, a low-income worker, is asked by
Q23: The United States has a slightly _
Q24: Several studies show that over half the
Q25: A quintile is<br>A) equal to 25%.<br>B) a