Multiple Choice
(Figure: Long-Run and Short-Run Average Total Cost Curves) In the figure, which level of output represents minimum efficient scale?
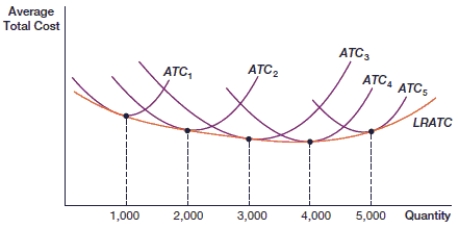
A) 2000
B) 3000
C) 4000
D) 5000
Correct Answer:

Verified
Correct Answer:
Verified
Related Questions
Q90: (Figure: MPP L) In the figure, what
Q91: Total revenue minus total cost is:<br>A) loss.<br>B)
Q92: (Figure: Production Function Data 0) In
Q93: The additional output from an additional unit
Q94: (Figure: MPP L) In the figure, what
Q96: Edward uses $10,000 from his savings (earning
Q97: The vertical distance between the average total
Q98: (Figure: Long-Run and Short-Run Average Total Cost
Q99: _ profit is total revenue minus implicit
Q100: Explain why zero economic profit is not