Multiple Choice
(Figure: Long-Run and Short-Run Average Total Cost Curves) In the figure, which level of output represents diseconomies of scale?
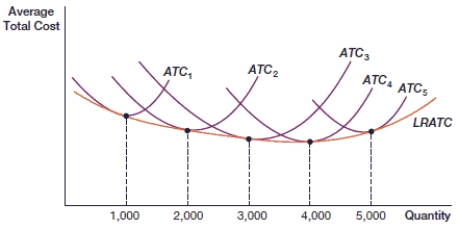
A) 2000
B) 3000
C) 4000
D) 5000
Correct Answer:

Verified
Correct Answer:
Verified
Related Questions
Q117: _ costs are explicit costs of production.<br>A)
Q118: (Figure: Costs) In the figure, which represents
Q119: Average _ cost is total cost per
Q120: (Figure: MPP L) In the figure, what
Q121: According to _, marginal cost increases as
Q123: _ profit entails a normal accounting profit.<br>A)
Q124: The _ total cost curve is the
Q125: (Figure: MPP L) In the figure, what
Q126: Wayne, a small business owner, had production
Q127: Average _ cost is variable costs per