Multiple Choice
The accompanying figure shows data on composite values for beak size,beak shape,and body size for the medium ground finch (Geospiza fortis) inhabiting Daphne Major.Complete data sets were collected from 1973 onward. 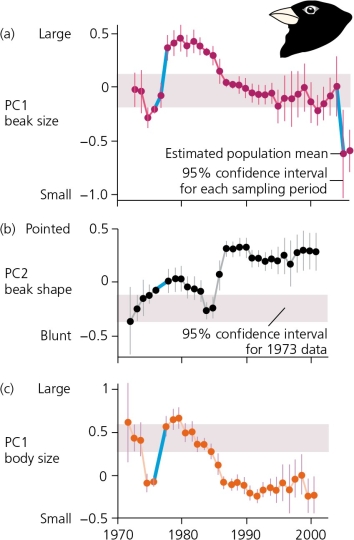
For each of the three graphs in the accompanying figure,the 95% confidence intervals are shown as vertical bars extending above and below each data point for each year.The fact that many of these 95% confidence intervals do not overlap with the data from 1973 (the original reference point for this study) do not overlap reveals that ________.
A) no detectable change in these phenotypes was measured
B) no evolution can be documented
C) detectable change in phenotypes was observed, but the changes were not heritable
D) detectable evolution by natural selection did occur
E) None of these is an accurate statement.
Correct Answer:

Verified
Correct Answer:
Verified
Q9: Compare and contrast the experimental work of
Q10: Regarding the nature of natural selection,which of
Q11: Social,political,and legal controversy surrounding acceptance of evolution
Q12: Evolution by natural selection _.<br>A) requires that
Q13: Darwin's calculations on elephant reproduction under ideal
Q15: Rewrite Darwin/Wallace's four tenets of natural selection
Q16: Darwin confirmed the concept of evolution under
Q17: Darwin developed his theory of natural selection
Q18: Which of the following U.S.Supreme Court decisions
Q19: Before Mendel's work was rediscovered,some argued that