Multiple Choice
The mean and standard error bars for four data sets are shown in the figure. Which of the data sets most likely has a variance of 64 and a sample size of 16?
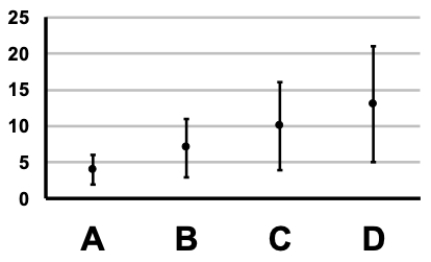
A) Plot A
B) Plot B
C) Plot C
D) Plot D
Correct Answer:

Verified
Correct Answer:
Verified
Related Questions
Q1: It is possible for the standard deviation
Q3: If a sample with 40 values has
Q4: Sketch a figure showing the mean and
Q5: The standard deviation measures the spread of
Q6: If a sample with 16 values has
Q7: The sampling distribution of an estimate is
Q8: The 95% confidence interval is best thought
Q9: Describe the relationship between a population and
Q10: What is the standard error for a
Q11: If a sample with a standard deviation