Multiple Choice
The mean and 95% confidence interval bars for four data sets are shown in the figure. Which of the data sets most likely has a variance of 81 and a sample size of 36?
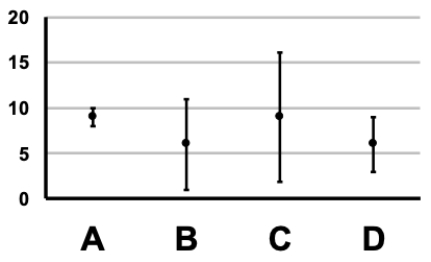
A) Plot A
B) Plot B
C) Plot C
D) Plot D
Correct Answer:

Verified
Correct Answer:
Verified
Related Questions
Q9: Describe the relationship between a population and
Q10: What is the standard error for a
Q11: If a sample with a standard deviation
Q12: The symbol σ represents the population standard
Q13: Which of the following best describes a
Q15: If a sample with a standard deviation
Q16: The symbol Ȳ represents the population mean.
Q17: The 95% confidence interval is best thought
Q18: If a sample of size of 30
Q19: It is possible for the variance and