Multiple Choice
The mean and 95% confidence interval bars for four data sets are shown in the figure. Which of the data sets most likely has a variance of 100 and a sample size of 16?
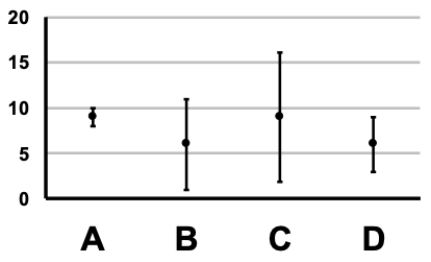
A) Plot A
B) Plot B
C) Plot C
D) Plot D
Correct Answer:

Verified
Correct Answer:
Verified
Related Questions
Q32: Which of the following describes the width
Q33: The larger the sample size, the narrower
Q34: If a sample with a standard deviation
Q35: Error bars on a graph typically indicate
Q36: The population of all sample means that
Q38: If a sample of size of 20
Q39: Sketch a figure showing the mean and
Q40: For a sample with a mean of
Q41: For a sample with a mean of
Q42: In your own words, describe a pair