Not Answered
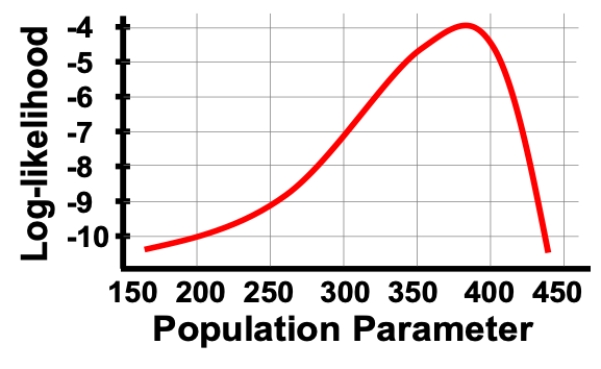
Consider a situation in which we plot the log-likelihood values for a range of parameter values as shown in the figure. What is the MLE and 95% confidence interval of the MLE based on this figure?
Correct Answer:

Verified
Correct Answer:
Verified
Related Questions
Q1: Larger sample sizes reduce the bias often
Q2: Likelihood measures the probability that the null
Q3: Describe the logic of the log-likelihood ratio
Q4: For a likelihood ratio test in which
Q6: The maximum likelihood estimate is the parameter
Q7: The maximum likelihood estimate (MLE) can be
Q8: If the null hypothesis is true, then
Q9: To find the 95% confidence interval for
Q10: The maximum likelihood estimate is the highest
Q11: Which of the following is the