Multiple Choice
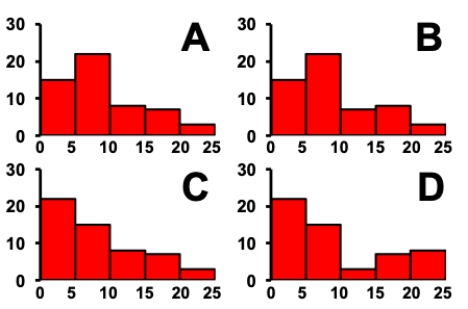
Consider the data table that indicates how many subjects in a skin cancer study had various numbers of moles on their backs. Which of the histograms correctly depicts the data?
?
Frequency table showing the number of moles on the backs of 55 subjects.
? ?
?
A) Chart A
B) Chart B
C) Chart C
D) Chart D
Correct Answer:

Verified
Correct Answer:
Verified
Q39: Effective graphs are designed to accomplish three
Q40: Which of the following is generally true
Q41: When looking at a color map that
Q42: When designing a table of data values,
Q43: What of the following is the best
Q45: If you saw a graph with rectangles
Q46: Consider the histogram shown. What two words
Q47: Consider the histogram of a data set
Q48: Consider an experiment in which rats are
Q49: Essentially, all professional statistics software programs can