Multiple Choice
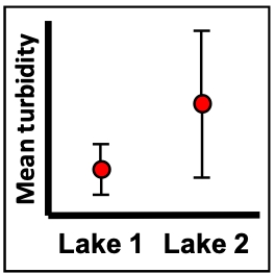
Imagine a series of turbidity (cloudiness) measurements in the water from two different lakes. The measurements were taken over many different days (30 samples for each lake) and the figure shows the mean turbidity of those measurements along with bars representing 95% confidence intervals. What can we conclude about the appropriate null hypothesis and mean turbidity of the two lakes?
A) Fail to reject the null hypothesis, we lack evidence that the turbidity differs between the lakes.
B) Reject the null hypothesis, we have evidence that the turbidity differs between the lakes.
C) Reject the null hypothesis, we lack evidence that the turbidity differs between the lakes.
D) We can't really tell from this figure whether the null hypothesis will be rejected or not.
Correct Answer:

Verified
Correct Answer:
Verified
Q23: Consider a situation in which Chris
Q24: Draw a flowchart to describe the steps
Q25: Consider an urban ecologist who is interested
Q26: Consider a study in which two sets
Q27: If the means of two populations are
Q29: Consider urban ecologists who are interested in
Q30: Consider an urban ecologist who is interested
Q31: Welch's t-test may only be used when
Q32: Consider a situation in which Chris
Q33: Consider a situation in which Chris