Not Answered
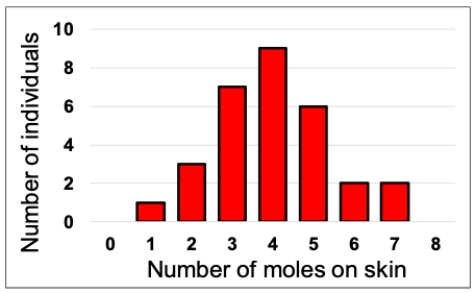
Consider the figure shown indicating the number of moles on the skin of a set of 30 patients examined by a dermatologist. Published reports claim that the mean number for the population these patients come from is 3.4 moles. Conduct a one-sample t-test on this data and determine whether this seems to be true. Assume a = 0.5. In your answer, present the following: your calculated t-value, an exact P-value using a computer or a range for the P-value using a table of critical values, and a statement about whether the population mean appears to be 3.4 or not based on the sample.
Correct Answer:

Verified
Correct Answer:
Verified
Q12: Consider a data sample consisting of 12
Q13: If a t-test results in a sample
Q14: The t-distribution is wider than the normal
Q15: Consider a data sample consisting of 12
Q16: How many standard errors in width is
Q18: The t-distribution is wider for larger sample
Q19: For a t-test using a sample of
Q20: Consider an experiment in which Shireen measures
Q21: The critical t-value represented by t<sub>0.025(2),20</sub> is
Q22: In tables of critical t-values, what value