Multiple Choice
(Figure: Understanding Network Good Markets) The graph depicts the market for a network good. What does H represent?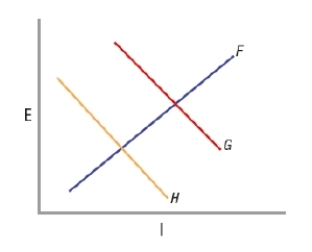
A) price
B) private demand
C) social demand
D) quantity
Correct Answer:

Verified
Correct Answer:
Verified
Related Questions
Q131: The short-run supply curve for a network
Q132: The network demand curve is negatively sloped.
Q133: (Table: Online Dating Web Sites) From
Q134: The short-run supply curve for a network
Q135: Inputs that are needed to produce a
Q137: ExLibris Publishing first releases books it publishes
Q138: Some butcher shops offer "meat deals," which
Q139: The market equilibrium for a network good
Q140: Intertemporal pricing is a versioning strategy of
Q141: Movies are typically shown in theaters for