Multiple Choice
(Figure: Network Market Demand Curve) The graph depicts a network market demand curve. Along the quantity axis (x axis) , casual users fall on the _____ portion and core users fall on the _____ portion.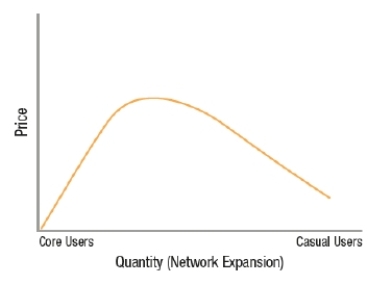
A) left; center
B) left; right
C) center; right
D) right; left
Correct Answer:

Verified
Correct Answer:
Verified
Q207: Versioning is a type of<br>A) bundling.<br>B) intertemporal
Q208: Explain how a food court at a
Q209: The ability to sign up for a
Q210: Microsoft Word is often available as a
Q211: The market equilibrium for a network good
Q213: Standards wars are a common issue with
Q214: Which of these is an example of
Q215: Network externalities benefit the user who generates
Q216: A pricing strategy that involves differentiating a
Q217: Which statement describes the normal pricing pattern