Multiple Choice
(Figure: Peak-Load Pricing Model) The graph represents the market for a good that follows a peak-load pricing model. Which curve represents marginal revenue during a peak period?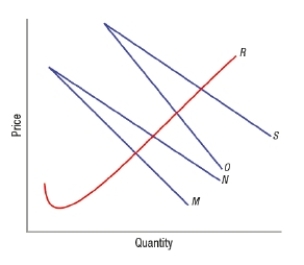
A) M
B) N
C) O
D) S
Correct Answer:

Verified
Correct Answer:
Verified
Related Questions
Q145: What is a network good? Give an
Q146: An industry standard is a common format
Q147: The phone company AT&T was broken up
Q148: Can bad regulation be worse than no
Q149: Suppose your bank opens up a dozen
Q151: A network that combines elements of physical
Q152: A network good is one of which
Q153: The external benefit of an additional subscriber
Q154: The purpose of regulatory policy is to<br>A)
Q155: Getcha-There-In-One-Piece Airline charges higher ticket prices for