Multiple Choice
(Figure: Peak-Load Pricing Model) The graph represents the market for a good that follows a peak-load pricing model. Which curve represents marginal cost?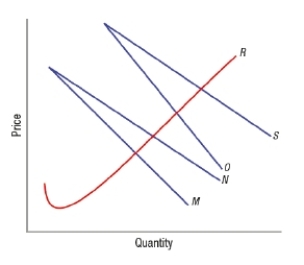
A) M
B) N
C) O
D) R
Correct Answer:

Verified
Correct Answer:
Verified
Related Questions
Q102: For someone to cancel cable service, the
Q103: What is likely to happen in the
Q104: Which of these is NOT an example
Q105: Which statement describes a basic difference between
Q106: A hotel room at a ski resort
Q108: What is the difference between a virtual
Q109: Home Internet services are often sold with
Q110: (Figure: Externalities and Network Effects) Based on
Q111: A network good is one where the
Q112: Explain what a virtuous cycle is and