True/False
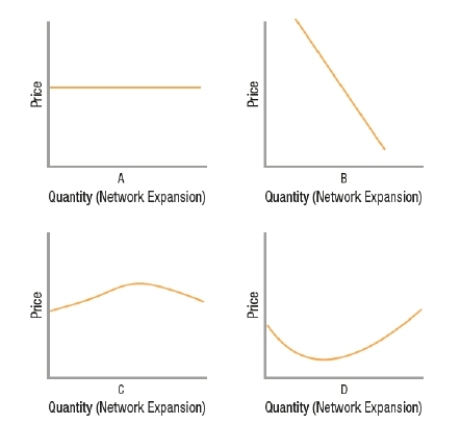
(Figure: Network Market Curves) Based on the graphs, the curve marked D represents the demand curve for a network good.
Correct Answer:

Verified
Correct Answer:
Verified
Related Questions
Q16: Any regulatory policy should be evaluated based
Q17: Which example is NOT part of a
Q18: In the downward-sloping segment of a network
Q19: Firms use lock-in strategies to make it
Q20: There are two main types of cell
Q22: If a musical artist wants to generate
Q23: Which statement is NOT true?<br>A) A network
Q24: The market leader in a network industry
Q25: The reason someone can open a text
Q26: The critical mass for a network good