True/False
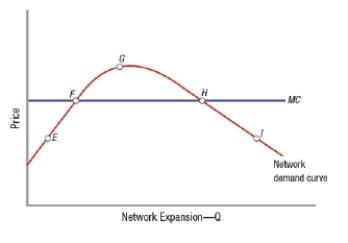
(Figure: Market for a Network Good 2) The graph depicts a market for a network good. Point G represents equilibrium after a virtuous cycle takes hold.
Correct Answer:

Verified
Correct Answer:
Verified
Related Questions
Q231: The tipping point from which a virtuous
Q232: (Table: Online Dating Web Sites) From
Q233: Use supply and demand curves to illustrate
Q234: Which of these is NOT a type
Q235: A network connected by a transportation route
Q237: The Internet created a rise in the
Q238: When one makes a call to someone
Q239: When a network has a fixed capacity,
Q240: Which statement describes the tipping point in
Q241: Which of these has gained market share