menu-iconExamlexExamLexServices

Discover

Ask a Question
  1. All Topics
  2. Topic
    Business
  3. Study Set
    Microeconomics Principles for a Changing World
  4. Exam
    Exam 14: Network Goods
  5. Question
    (Figure: Market for a Network Good 2) the Graph Depicts
Solved

(Figure: Market for a Network Good 2) the Graph Depicts

Question 113

Question 113

True/False

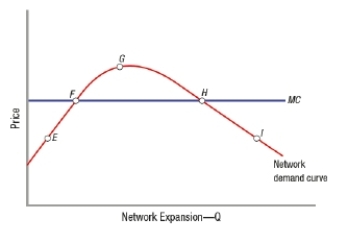
(Figure: Market for a Network Good 2) The graph depicts a market for a network good. If demand fails to reach point G, the company may lose market share.

Correct Answer:

verifed

Verified

Unlock this answer now
Get Access to more Verified Answers free of charge

Related Questions

Q108: What is the difference between a virtual

Q109: Home Internet services are often sold with

Q110: (Figure: Externalities and Network Effects) Based on

Q111: A network good is one where the

Q112: Explain what a virtuous cycle is and

Q114: During the upward sloping part of a

Q115: Facebook experienced a _ cycle when a

Q116: (Figure: Market for a Network Good 2)

Q117: Core users of a network good appear

Q118: A firm "owns" a network when it

Examlex

ExamLex

About UsContact UsPerks CenterHomeschoolingTest Prep

Work With Us

Campus RepresentativeInfluencers

Links

FaqPricingChrome Extension

Download The App

Get App StoreGet Google Play

Policies

Privacy PolicyTerms of ServiceHonor CodeCommunity Guidelines

Scan To Download

qr-code

Copyright © (2025) ExamLex LLC.

Privacy PolicyTerms Of ServiceHonor CodeCommunity Guidelines