Multiple Choice
(Figure: Labor Supply Curve) Based on the graph, we see that this person is willing to supply _____ hours of labor at wage rate W1 than at W2 and _____ hours of labor at wage rate W3 than at W2.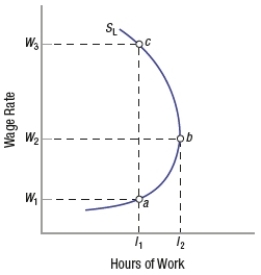
A) more; more
B) more; fewer
C) fewer; fewer
D) fewer; more
Correct Answer:

Verified
Correct Answer:
Verified
Related Questions
Q55: Costs of union membership include all of
Q56: In the United States, it is illegal
Q57: Which piece of legislation is also known
Q58: (Table) Based on the table, if
Q59: Which legislative act MOST directly addresses wage
Q61: In the following graph, the product market
Q62: Critics of affirmative action state that the
Q63: (Figure: Determining Labor and Wages) A firm
Q64: According to the segmented labor market view,
Q65: Workers' skills in one industry do not