Multiple Choice
(Figure: Labor Supply Curve) Based on the graph, the income effect is shown by segment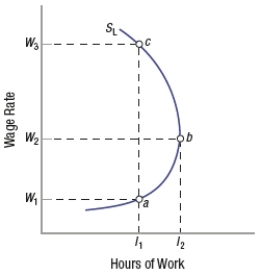
A) ab.
B) ac.
C) bc.
D) abc.
Correct Answer:

Verified
Correct Answer:
Verified
Related Questions
Q99: Theoretically, how would an individual working at
Q100: Because P > MR, which equation applies
Q101: According to the income effect, if an
Q102: The income effect on the labor supply
Q103: Robotic manufacturing has made labor demand for
Q105: (Table: Labor and Quantity of Output)
Q106: What would happen to wages and labor
Q107: The competitive labor market determines the equilibrium
Q108: Suppose Alcoa, Inc. is a monopsonist employer
Q109: The "substitution effect" for labor supply states