Multiple Choice
(Figure: Monopolists in Monopsony Markets) The graph depicts a firm that is a monopolist in the product market but a monopsony in the input market. Which curve represents the marginal revenue product of labor?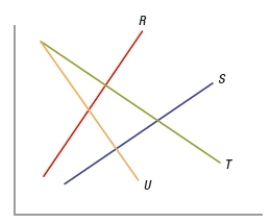
A) R
B) S
C) T
D) U
Correct Answer:

Verified
Correct Answer:
Verified
Related Questions
Q272: In the following individual labor supply curve,
Q273: The age discrimination clause in the Employment
Q274: When the individual labor supply curve is
Q275: An increase in population will<br>A) not affect
Q276: Abdul signed a labor contract that has
Q278: (Table) Based on the table, the
Q279: Ceteris paribus, what is likely to happen
Q280: Acme Corporation employs workers practicing a variety
Q281: In a competitive labor market, if a
Q282: Which of these is NOT a reason