Multiple Choice
(Figure: Interpreting Cost and Revenue Curves) The graph shows the cost and revenue curves for a monopolist. Based on the graph, the monopolist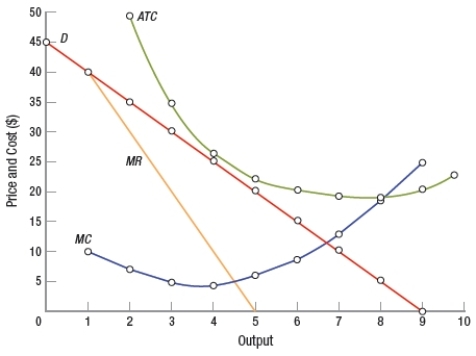
A) suffers a loss.
B) earns normal profit.
C) earns economic profit.
D) breaks even.
Correct Answer:

Verified
Correct Answer:
Verified
Q125: Firm X is a monopoly. It is
Q126: What might keep temporary monopolists from charging
Q127: (Figure: Monopolies Versus Competitive Industries) Based on
Q128: Which of these is an example of
Q129: Which of these regulatory systems for a
Q131: Why aren't the prices in contestable markets
Q132: (Figure: Monopolies Versus Competitive Industries) Based on
Q133: Explain how barriers to entry affect the
Q134: Today, the primary role of antitrust law
Q135: Which strategy makes price discrimination more difficult