Multiple Choice
(Figure) The figure shows two demand curves for two different periods for the same product. Based on the information in the graph, which statement is TRUE?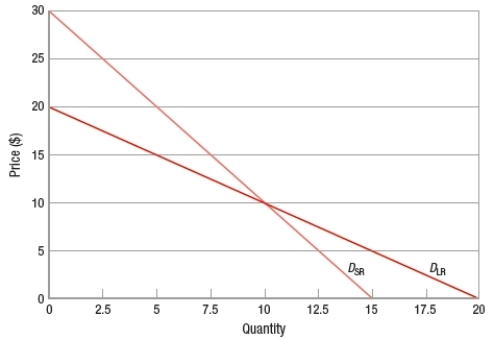
A) The flatter long-run demand curve implies that consumers have more time to adjust their behavior and find substitute goods.
B) The flatter long-run demand curve implies that more consumers find the product a necessity in the long run compared to the short run.
C) The steeper short-run demand curve implies that consumers spend a larger share of their income in the short run compared to the long run.
D) The steeper short-run demand curve implies consumers are more price sensitive in the short run compared to the long run.
Correct Answer:

Verified
Correct Answer:
Verified
Q78: If the price falls from $3 to
Q79: A normal good is a good that<br>A)
Q80: A poultry rancher discovered what when she
Q81: Suppose the price elasticity of demand is
Q82: The current equilibrium price in the market
Q84: Suppose that the price of unlimited monthly
Q85: The current equilibrium price and quantity in
Q86: If the income elasticity of demand for
Q87: Why is elasticity measured using percentage changes?
Q88: Moving upward along a linear demand curve,